Installation
Download and run the correct installer:
Data Entry
The first step is to tell the program about your financial situation. When the program first starts, the window looks like this:
Use the tabs at the top to go through the pages of information the program needs you to enter. Follow the links below for detailed instructions for each tab.
Scenario (save/load)
As you enter data, occasionally click the “Save” button at the bottom of the screen. That will save this scenario (all the data you have entered) to a file. The first time you save, the program will ask you for a filename and location. The next time the program runs, this scenario will be loaded.
You can start a new scenario with the “New Scenario” button. This is useful to keep multiple asset setups or retirement plans saved. If you have multiple scenarios, you can use the “Load Scenario” button to switch between them.
Running the Simulation
Once you have entered all your information, it is time to run the simulator. Press the “Run Full Sim” button. This will simulate your retirement 50,000 times with different market conditions.
It can take a while to run the simulation, especially on older hardware.
Understanding the results
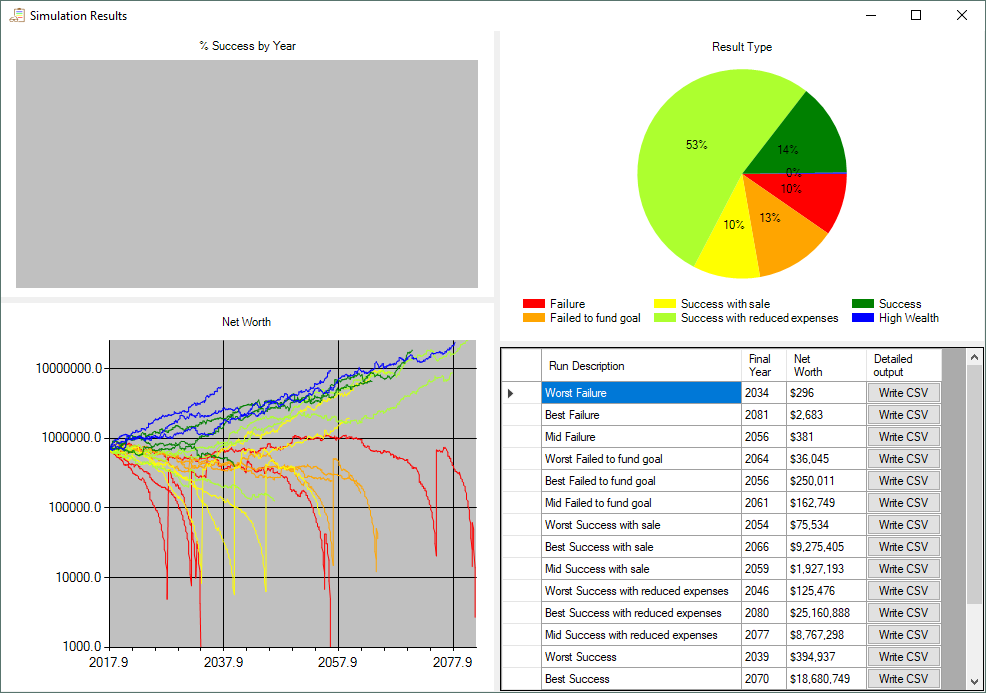
When the simulation is complete, another window will appear with the results:
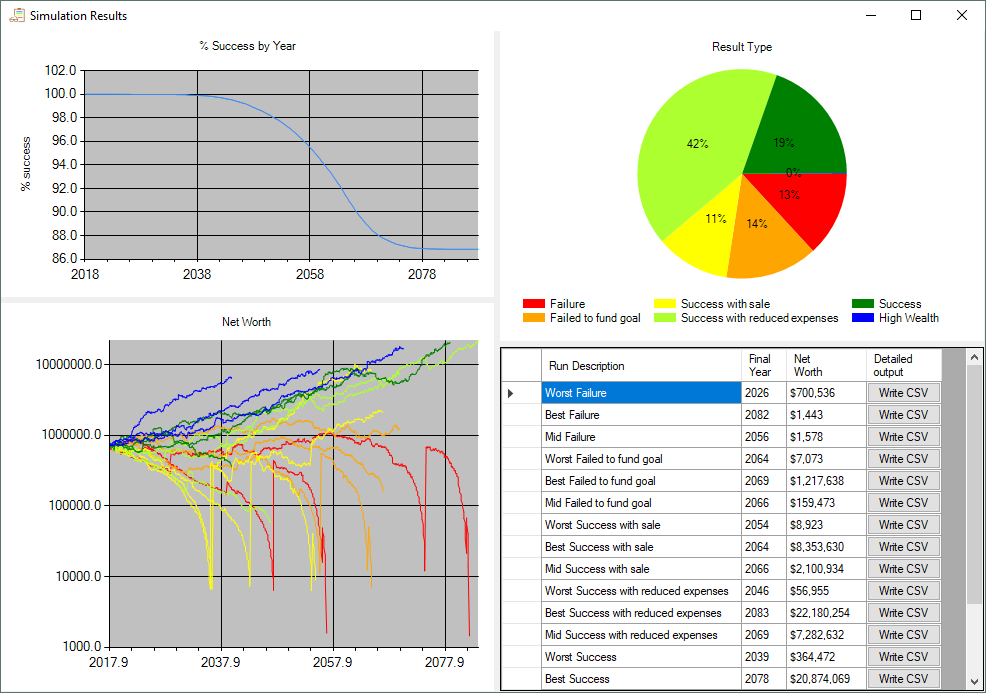
Success graph
The graph in the upper left shows what percent of the runs were still successful over time. This can give you a good sense of both how likely it is that you will be successful, and what periods caused problems.
Result type pie chart
The pie chart in the upper right breaks down the runs by percent that ended with each success type. The types are:
- Failure – The couple ran out of money to pay expenses
- Failed to fund goal – The couple didn’t run out of money, but was unable to either buy a property or have enough money to meet their legacy goal.
- Success with sale – The couple had to sell an asset to pay expenses
- Success with reduced expenses – The couple reduced their expenses (as defined on the expenses page) during the simulation, but didn’t have to sell an asset
- Success – The couple never had to sell an asset or reduce their expenses
- High wealth – The couple ended with a net worth greater than 200x their non-tax expenses.
Net worth graph
The graph in the bottom left shows the couple’s net worth over time (in today’s dollars) for up to three runs of each result type. The simulation saves the “best”, “worst” and “mean” run for each type for display on the net worth graph and the table.
For a failure or a high wealth scenario, best/worst is determined by the year that it happened. For the other result types, best/worst is determined by the net worth of the couple at their death.
Run Summary table
The table on the right shows the same set of runs displayed on the net worth graph and allows you to see details about what happened in each run. Clicking the “Write CSV” button will create a CSV file that can be viewed by any spreadsheet program (like Excel). The file will contain month-by-month details about the markets, expenses, account values, taxes, etc. So that you can see exactly what happened in that run. All values in the CSV file are current day dollars. So even though there is inflation happening, all the values you see are inflation adjusted.
Tweaking the scenario
Quick Sim
Once the run is completed, you can make changes to your scenario and get a quick idea of how that would change the results by going back to the data entry pages, changing the parameters, and clicking the “Quick Sim” button. That will take the new scenario and apply it to “representative” runs from the full simulation. This works fine for small changes, but if you are getting significantly different results from a Quick Sim than you did from the original run, you should run another “Full Sim”.
Stress Testing
The stress testing page lets you try out your retirement in historically bad times or with personal difficulties.
Historical scenarios
- Great depression – The external markets will replicate what really happened between 1929 and 1941 for the first 11 years of the run.
- 2008 crash – Replicates the 2008 crash for the first two years of the run. (This includes real-estate prices)
- 1970s inflation – The external markets will replicate what really happened between 1968 and 1982 for the first 11 years of the run.
I don’t include an option for a hyperinflation scenario because there aren’t enough historical examples to have a good idea what would actually happen. Most people guess that stocks would mostly keep up with inflation because they are a share of a tangible business. Bonds would become worthless as would any cash savings.
Personal crises
- No Inheritance: Makes inheriting money impossible.
- Pension failure: No annuity or social security income.
- Early death of spouse: Forces one member of a couple to die after the first year.
- Large medical expense: When the first member of the couple dies, the program creates a large one-time expense (defaults to $500,000).
Story Mode
This works like the “Write CSV” button on the result page to run a single simulation and write month-by-month statistics to a CSV file so that you can see exactly what happened. The “Random Seed” determines what happens in the external markets. Set this to different values to see different random simulations.
Many Simulations
You can run more than 50K runs at once if you’d like. Enter the number of 50K runs to do and hit “Run”. If you get different results with two “Full Sim” runs, your situation might be unusually sensitive to market conditions or you may have set the market to be more random. In that case, you can use this to run more trials and average all the results.